San Rafael Tides: Tide Chart and Times
Marin County, California · Pacific time · feet
The tide at San Rafael today starts with a high of 4.6 ft at 6:17 AM, falls to a low of 3.2 ft at 10:40 AM, climbs to a high of 5.8 ft at 4:26 PM, then falls to a low of −0.4 ft at 11:46 PM.
The rising tide is now 5.8 ft
Next high
1m
4:26 PM
Next low
7h 21m
11:46 PM
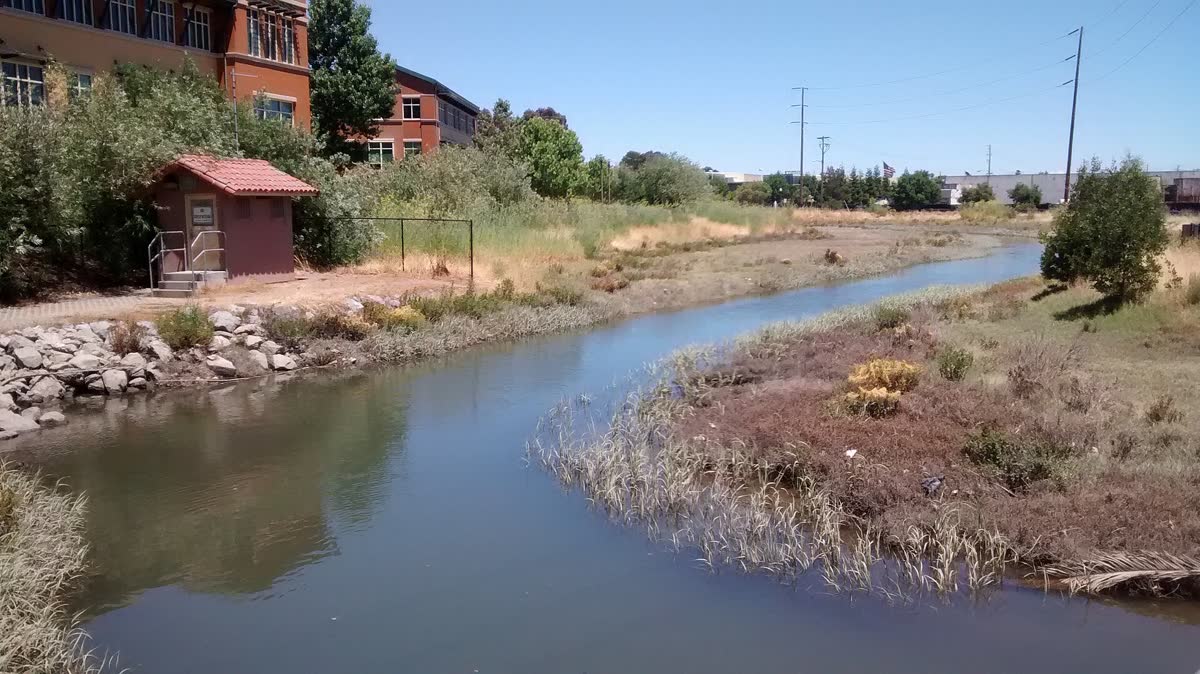
San Rafael meets the bay at the San Rafael Canal and the low Canal neighborhood east of downtown. The tide matters most here at the top end, when high water backs up into streets built on old marsh.
Also covers San Rafael Canal, San Quentin, Loch Lomond.
Saturday, October 31
Saturday, October 31
- ▲ ▲ High tide6:17 AM4.6 ft 4.6 ft
- ▼ ▼ Low tide10:40 AM3.2 ft 3.2 ft
- ▲ ▲ High tide4:26 PM5.8 ft 5.8 ft
- ▼ ▼ Low tide11:46 PM−0.4 ft −0.4 ft
Sunday, November 1
- ▲ ▲ High tide6:22 AM4.7 ft 4.7 ft
- ▼ ▼ Low tide11:14 AM3.0 ft 3.0 ft
- ▲ ▲ High tide4:41 PM5.3 ft 5.3 ft
- ▼ ▼ Low tide11:54 PM−0.1 ft −0.1 ft
Monday, November 2
- ▲ ▲ High tide7:17 AM5.0 ft 5.0 ft
- ▼ ▼ Low tide12:41 PM2.5 ft 2.5 ft
- ▲ ▲ High tide6:03 PM5.0 ft 5.0 ft
Tuesday, November 3
- ▼ ▼ Low tide12:56 AM0.1 ft 0.1 ft
- ▲ ▲ High tide8:03 AM5.3 ft 5.3 ft
- ▼ ▼ Low tide1:51 PM1.9 ft 1.9 ft
- ▲ ▲ High tide7:25 PM4.8 ft 4.8 ft
Wednesday, November 4
- ▼ ▼ Low tide1:50 AM0.4 ft 0.4 ft
- ▲ ▲ High tide8:42 AM5.6 ft 5.6 ft
- ▼ ▼ Low tide2:49 PM1.3 ft 1.3 ft
- ▲ ▲ High tide8:39 PM4.7 ft 4.7 ft
Thursday, November 5
- ▼ ▼ Low tide2:37 AM0.8 ft 0.8 ft
- ▲ ▲ High tide9:17 AM5.8 ft 5.8 ft
- ▼ ▼ Low tide3:38 PM0.7 ft 0.7 ft
- ▲ ▲ High tide9:45 PM4.7 ft 4.7 ft
Friday, November 6
- ▼ ▼ Low tide3:19 AM1.2 ft 1.2 ft
- ▲ ▲ High tide9:50 AM6.0 ft 6.0 ft
- ▼ ▼ Low tide4:22 PM0.1 ft 0.1 ft
- ▲ ▲ High tide10:45 PM4.7 ft 4.7 ft
Today and Tomorrow at San RafaelThis Week at San Rafael
Feet above MLLW · Pacific time · shaded = night
Tap the chart for the height at any time. The full week is in the table below.Hover or tap the chart for the height at any time.
Predicted vs Actual Water Level
NOAA Richmond gauge · last 2448 hours
Tide predictions cover only the pull of the moon and sun. NOAA's Richmond gauge, about 6 miles away, measures the real water level every 6 minutes, so the gap between the two lines is the weather: storm surge, wind, air pressure and runoff. The same gap usually holds across this part of the bay.
Loading live readings from NOAA…
Predicted Measured
Today at a Glance
Tidal range today
6.2 ft
Typical this month: 5.9 ft
Spring and neap cycle
Between springs and neaps
Next spring tide Nov 9, next neap Nov 3
How they work →Moon
Waning gibbous
60% lit, waning. New moon Nov 8
Sunrise and sunset
7:34 AM / 6:12 PM
10h 38m of daylight
San Rafael Tide Table, Next 7 Days
From today · Pacific time
Today, Oct 31
- ▲ High 6:17 AM4.6 ft
- ▼ Low 10:40 AM3.2 ft
- ▲ High 4:26 PM5.8 ft
- ▼ Low 11:46 PM−0.4 ft
Sunday, Nov 1
- ▲ High 6:22 AM4.7 ft
- ▼ Low 11:14 AM3.0 ft
- ▲ High 4:41 PM5.3 ft
- ▼ Low 11:54 PM−0.1 ft
Monday, Nov 2
- ▲ High 7:17 AM5.0 ft
- ▼ Low 12:41 PM2.5 ft
- ▲ High 6:03 PM5.0 ft
Tuesday, Nov 3
- ▼ Low 12:56 AM0.1 ft
- ▲ High 8:03 AM5.3 ft
- ▼ Low 1:51 PM1.9 ft
- ▲ High 7:25 PM4.8 ft
Wednesday, Nov 4
- ▼ Low 1:50 AM0.4 ft
- ▲ High 8:42 AM5.6 ft
- ▼ Low 2:49 PM1.3 ft
- ▲ High 8:39 PM4.7 ft
Thursday, Nov 5
- ▼ Low 2:37 AM0.8 ft
- ▲ High 9:17 AM5.8 ft
- ▼ Low 3:38 PM0.7 ft
- ▲ High 9:45 PM4.7 ft
Friday, Nov 6
- ▼ Low 3:19 AM1.2 ft
- ▲ High 9:50 AM6.0 ft
- ▼ Low 4:22 PM0.1 ft
- ▲ High 10:45 PM4.7 ft
Minus Tides at San Rafael
Daylight low tides below zero in the next 60 days, the best times for tidepooling and walking the low beach. More on what a minus tide is.
- Saturday, Nov 7, 5:01 PM−0.2 ft
- Sunday, Nov 22, 4:25 PM−0.5 ft
- Monday, Nov 23, 5:08 PM−1.0 ft
- Saturday, Dec 5, 4:10 PM−0.2 ft
- Sunday, Dec 6, 4:49 PM−0.5 ft
- Sunday, Dec 20, 3:21 PM−0.3 ft
- Monday, Dec 21, 4:08 PM−0.9 ft
- Tuesday, Dec 22, 4:55 PM−1.3 ft
San Rafael Tides and the Canal Neighborhood
San Rafael tides peak about 40 minutes after the Golden Gate, based on NOAA’s offsets for Point San Quentin. Tides here are predicted from NOAA’s Point San Quentin station, about 2 miles away. Low tide comes about 50 minutes after the Golden Gate.
The San Rafael Canal runs in from the bay toward downtown, and the water in it rises and falls with every tide.
Why High Tides Flood the Canal
The Canal neighborhood is a 2.2-square-mile peninsula of filled land, home to more than 13,000 people. The City of San Rafael says much of it sits below daily high tides, with little protection from king tides and storm surges.
The ground is also sinking. The fill was laid over marsh more than a century ago and keeps compacting, and a city study found some spots are dropping several times faster than the sea is rising. The two main roads out of the neighborhood are already lower than the year’s highest tide.
That is why a king tide on a sunny day can put water in Canal streets and parking areas. Add a winter storm and the flooding gets worse.
The city has studied three main fixes: floodwalls, a tidal gate at the mouth of the canal, or raising land along the shoreline.
Tides Near San Rafael
All Marin tides →How the tide is running right now at the closest spots.
Also close to San Rafael: Tiburon 7.0 mi · Sausalito 7.6 mi · Muir Beach 8.6 mi · Stinson Beach 9.3 mi · Rodeo Beach 9.7 mi
Where the San Rafael Tide Station Is
37.9450, -122.4750
Tide times for San Rafael come from NOAA's Point San Quentin tide station (9414873), about 2.0 miles away.
About Tides at San Rafael
How the tide works at San Rafael
San Rafael gets mixed semidiurnal tides, the usual pattern on the California coast: two highs and two lows most days, with one high noticeably higher than the other and one low noticeably lower. The lower low is the one that uncovers the most shore.
A typical day here swings about 5.9 ft from low water to the next high. The biggest spring tides of the next month stretch that to about 8.5 ft, and the quietest neap days shrink it to about 3.5 ft. The next spring tides peak around Nov 9.
Where the San Rafael predictions come from
Every time and height is a NOAA prediction for NOAA's Point San Quentin tide station (9414873), about 2.0 miles away. It is a subordinate station: NOAA predicts its highs and lows by applying time and height offsets to the San Francisco (Golden Gate) reference station.
The curve between each high and low is drawn with the standard cosine method, so heights between the turns are close estimates. Weather can move the real water level: strong onshore wind and low air pressure raise it, and offshore wind and high pressure lower it. Read more on how tide predictions work.
Reading the tide clock, table and chart
The tide clock's hand sweeps from high tide at the top to low tide at the bottom and back, one full turn per tidal cycle of about 12 hours and 25 minutes. The countdowns on either side show the time to the next high and the next low.
The day picker and the 7-day table list each turn of the tide with its time and height. On the chart, each crest is a high and each trough a low; shaded bands are night. Heights are feet above mean lower low water, so a negative number is a minus tide. Our guide on how to read a tide chart goes further.
San Rafael Tide Questions
Does the Canal neighborhood in San Rafael flood at high tide?
Yes, on the highest tides. The City of San Rafael says much of the Canal neighborhood sits below daily high tides, with little protection during king tides and storm surges. Its two main exit roads are lower than the highest tide of the year, so a king tide can flood streets on a dry day.
Why is the Canal area of San Rafael so low?
The neighborhood is built on fill placed over a marsh more than a century ago, and that fill keeps compacting. A city study found some areas are sinking several times faster than the sea is rising. The ground goes down while the bay comes up.
How much later is high tide in San Rafael than at the Golden Gate?
About 40 minutes. NOAA's offsets for Point San Quentin put high tide about 42 minutes after the Golden Gate and low tide about 50 minutes after it. Heights there are close to the Golden Gate's, so the bigger difference is timing.
What time is high tide at San Rafael today?
The panel at the top lists today's highs and lows at San Rafael with their times and heights, and the tide clock counts down to the next high and the next low. Times are Pacific time and heights are in feet above mean lower low water (MLLW).
How big is the tide at San Rafael?
Over the next 30 days the daily swing at San Rafael runs from about 3.5 ft on the quietest neap days to 8.5 ft on the biggest spring tides, with 5.9 ft on a typical day. Like the rest of the California coast, most days bring two highs and two lows of unequal size.
Where do the San Rafael tide times come from?
They are astronomical predictions from NOAA's Point San Quentin tide station (9414873), about 2.0 miles away. Wind, storms, river runoff and air pressure can push the real water level higher or lower than predicted, so treat them as a planning guide, not a guarantee, and never use them for navigation.