Marine Tides and Weather: Why Wind and Pressure Change Tide Height
Marine tides and weather are two separate things that land on the same shoreline, and a tide chart only shows one of them. The chart predicts the pull of the moon and sun; the weather of the day then adds or subtracts water on top of that number, by a few inches most days and by a foot or more in a winter storm.
So if you find the water higher or lower than the prediction, nothing is broken. You are looking at the weather part.
Why the Tide Chart Is a Prediction, Not a Measurement
Tide predictions come from astronomy. NOAA measures the water at a station over years, works out which cycles belong to the moon, the sun and the shape of the coast, and projects them forward. Nothing in that math knows about next week’s storm.
A predicted high of 6.2 feet is the astronomical part only. The observed level is that tide plus whatever the atmosphere is doing. The difference between the two has a name: the residual, or in a storm, storm surge.
If the heights and the zero line are new to you, start with how to read a tide chart. The monthly rhythm behind the biggest highs and lowest lows is in spring and neap tides.
How Low Air Pressure Raises the Water
Air has weight. When a storm’s low pressure sits over the ocean it presses down less than usual, and the sea rises a little to balance it. This is the inverse barometer effect.
The rule of thumb is about 1 centimeter of rise for each millibar the pressure falls below average, which is near 1013 millibars. A deep Pacific low of 980 millibars is roughly 33 millibars low, so the effect works out close to a foot, spread over a wide patch of ocean.
That is an estimate, not a reading.
Why pressure alone rarely explains a flood
Pressure is the quiet part. The same storm brings wind, swell and rain, and those do far more at the shoreline. Pressure lifts the baseline a few inches. Wind and waves decide whether the water crosses the road.
Wind Setup: How Wind Piles Water Against the Shore
Wind drags on the surface and pushes water downwind. Where that water meets land it has nowhere to go but up, so the whole surface tilts. That tilt is wind setup.
Three things control it: wind speed, how long the wind has blown, and the fetch, meaning the stretch of open water it crossed. Shallow water piles up more than deep water for the same wind.
That is why the shallow bay side of Marin reacts so strongly to a steady southerly. Hours of hard wind on a rising tide is the setup behind most of the spots on our flooding map.
Swell, Wave Setup and Runup at the Beach
On the outer coast the biggest weather effect is not the water level. It is the waves.
Breaking surf pushes a mound of water against the beach, called wave setup, and each wave then runs up the sand past that. A tide chart shows neither one. With a big winter swell the wet line can sit well above where the same predicted tide would leave it on a calm day.
Read the tide height and the wave forecast together.
What Storm Surge Adds on Top of a High Tide
Storm surge is the rise above the predicted tide caused by a storm, mostly wind setup plus the pressure effect. Storm tide is the total you get: astronomical tide plus surge.
Timing decides the damage. A surge at low tide is usually a non-event, because there is room for the extra water. The same surge at the peak of a king tide is when salt water shows up on roads and parking lots.
Rain adds a third layer inland, because a high tide slows the outflow while runoff is still coming down the creeks.
Why a South Wind Matters in Tomales and Bodega Bay
Winter storms here usually arrive with wind from the south or southeast ahead of the front, then swing west or northwest behind it. A south wind is a warning. It comes with falling pressure, rain and building swell at the same time.
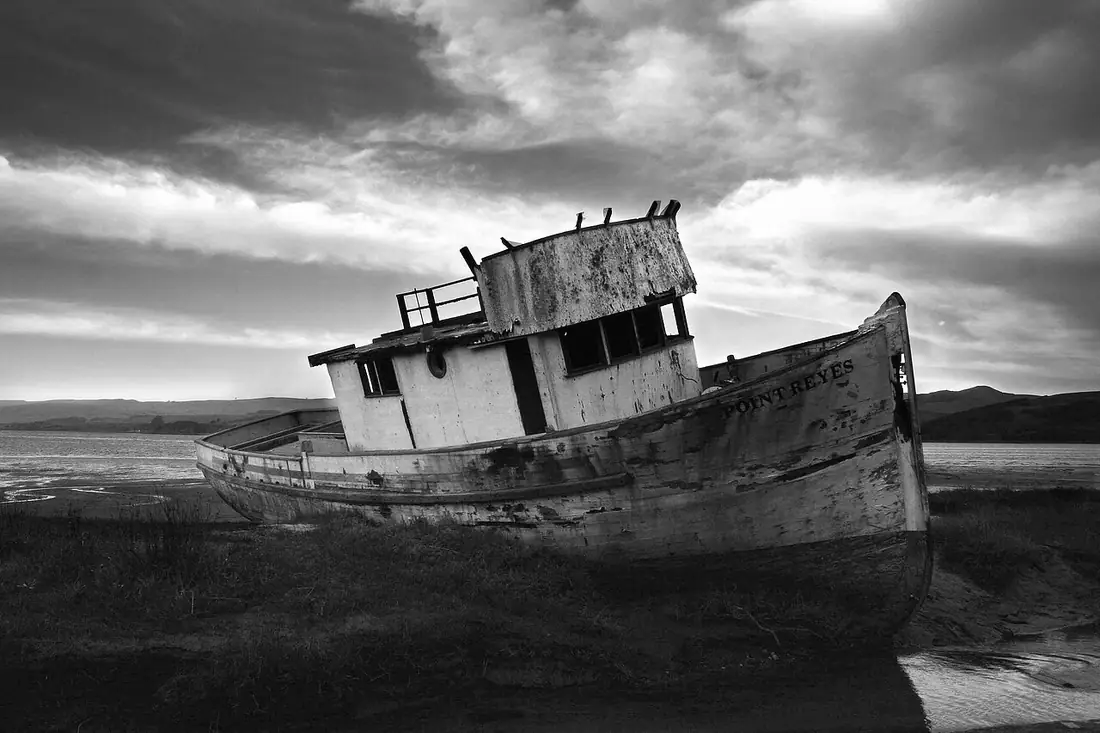
Tomales Bay runs northwest to southeast, with the mouth at the northwest end near Dillon Beach. A wind along that axis has the whole length of the bay as fetch. It tilts the water surface, so one end sits above the prediction and the other below, and it builds a short steep chop in an hour or two.
Bodega Bay is just over the Sonoma county line and gets the same systems. It opens toward the south, so a southerly storm wind blows straight in. For Bodega Bay weather and tides, pair the tide station nearest the harbor with the marine forecast from the Bay Area weather office for the same hours.
When Weather Pushes the Water Lower
It works both ways. A strong, cold high pressure ridge presses the surface down, and dry offshore wind from the northeast pushes water away from the shore.
A predicted minus tide can then drain further than the number says. Good news on a reef, bad news if you planned to float a boat over a shallow bar.
How to Check Observed Water Levels Against the Chart
- Note your predicted high or low and the hour it lands.
- Open your NOAA station on Tides and Currents and compare the predicted curve against the observed water level for the same hours.
- Read the wind and swell forecast for those same hours.
- Carry the difference from step 2 forward, since residuals tend to hold for hours rather than minutes.
What a typical difference looks like
Most days the gap is inches, not feet. In a strong storm, with a deep low, a long southerly fetch and big swell, the three effects add and the water can sit near a foot above the chart, higher still at the waterline once runup counts.
Where to Go Next
Your next step is the How Tide Predictions Work page. It walks through the harmonic math behind every height on the chart, which is the clearest way to see what the weather is adding on top.
Tides and Weather Questions
Why is the tide higher than the tide chart says?
Because the chart only predicts the astronomical tide, the pull of the moon and sun. Low air pressure, onshore wind and big swell all add water on top of that prediction. The extra height is called storm surge when a storm drives it. Compare the observed water level at your NOAA station against the predicted curve and you can see the difference for yourself.
How much does air pressure change tide height?
A useful rule of thumb is about 1 centimeter of water rise for every millibar the air pressure drops below average, which is near 1013 millibars. A deep winter low around 980 millibars works out to roughly a foot. The effect is broad and slow, so wind and waves usually matter more at any one beach.
What is the difference between storm surge and storm tide?
Storm surge is only the extra water a storm adds above the predicted tide, from wind pushing water toward shore plus low pressure letting the surface rise. Storm tide is the total level you actually get, meaning the predicted tide plus the surge. A moderate surge at low tide floods nothing. The same surge at a high tide peak is the problem.
Do tide charts include wind, waves and rain?
No. Tide predictions are astronomy, built from years of measurements at a station and projected forward using the cycles of the moon and sun. Wind, barometric pressure, swell, storm surge and river runoff are all left out. That is why the real water can run a foot above or below the printed height during a storm.
Can weather make a low tide lower than predicted?
Yes. Strong high pressure presses the sea surface down, and offshore wind from the northeast pushes water away from the coast, so a low tide can drain further than the chart says. Clear, cold, calm weather behind a front is the classic setup. That is a bonus for tidepooling and a hazard for boats crossing shallow bars.
Why does a south wind matter in Tomales Bay?
Tomales Bay runs northwest to southeast, so a wind along that axis works on the full length of the bay. It tilts the water surface, leaving one end above the predicted height and the other below, and it builds a short steep chop within an hour or two. A south wind also means falling pressure and rising swell, so the effects arrive together.